|
| |
The Theory
Overview and notation
The objective is to form a best guess as to the mastery state
(classification) of an individual examinee based on the examinee’s item
responses, a priori item information, and a priori population
classification proportions. Thus, the model has four components: 1) possible
mastery states for an examinee, 2) calibrated items, 3) an individual’s
response pattern, and 4) decisions that may be formed about the examinee.
There are K possible mastery states, that take on values mk. In
the case of pass/fail testing, there are two possible states and K=2. One
usually knows, a priori, the approximate proportions for the population
of all examinees in each mastery state.
The second component is a set of items for which the probability of each
possible observation, usually right or wrong, given each mastery state is also
known a priori,
The responses to a set of N items form the third component. Each item is
considered to be a discrete random variable stochastically related to the
mastery states and realized by observed values zN,. Each examinee has
a response vector, z, composed of z1, z2, ... zN.
Only dichotomously scored items are considered in this article.
The last component is the decision space. One can form any number of D
decisions based on the data. Typically, one wants to guess the mastery state and
there will be D=K decisions. With adaptive or sequential testing, a decision
will be to continue testing will be added and thus there will be D=K+1
decisions. Each decision will be denoted dk.
Testing starts with the proportion of examinees in the population that are in
each of the K categories and the proportion of examinees with each category that
respond correctly. The population proportions can be determined a variety of
ways including from prior testing, transformations of existing scores, existing
classifications, and judgement. In the absence of information equal priors can
be assumed. The proportions that respond correctly can be derived from a small
pilot test involving examinees that have already been classified or
transformations of existing data. Once these sets of priors are available, the
items are administered, responses (z1, z2, ... zN)
observed, and then a classification decision, dk, is made based on
the responses to those items.
Proportions from the pilot test are treated as probabilities and the
following notation is used:
- p(mk) - the probability of a randomly selected examinee
having a mastery state mk
- p(zn|mk) - the probability of response zn given
the k-th mastery state
- z - an individual’s response vector z1, z2,
..., zN where zi 0
(0,1)
An estimate of an examinee’s mastery state is formed using the priors and
observations. By Bayes Theorem,
|
|
(1) |
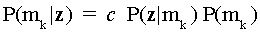
The posterior probability P(mk|z) that the examinee is of
mastery state mk given his response vector is equal to the product of
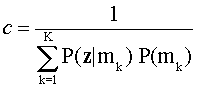
a normalizing constant (c), the probability of the response vector given
mk, and the prior classification probability. For each examinee,
there are K probabilities, one for each mastery state. The normalizing constant
in (1),
assures that the sum of the posterior probabilities equals 1.0.
Assuming local independence,
|
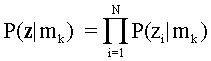
|
(2) |
That is, the probability of the response vector is equal to the product of
the conditional probabilities of the item responses. In this tutorial, each
response is either right (1) or wrong (0) and P(z1=0|mk) =
1- P(z1=1|mk).
Three key concepts from decision theory are discussed next:
1. decision rules - alternative procedures for classifying examinees
based on their response patterns,
2. sequential testing - alternative procedures for adaptively selecting
items based on an individuals response pattern, and
3. sequential decisions - alternative procedures for determining whether
to continue testing.
The model is illustrated here with an examination of two possible mastery
states m1 and m2 and two possible decisions d1
and d2 which are the correct decisions for m1 and m2,
respectively. The examples use a three item test with the item statistics shown
in Table 1. Further, also based on pilot test data, the prior classification
probabilities are P(m1)=0.2 and P(m2)=1-P(m1) =
0.8.In the example, the examinee’s response vector is [1,1,0].
|
Table 1: Conditional probabilities of a correct response, P(zi=1|mk) |
|
|
Item 1 |
Item 2 |
Item 3 |
|
Masters (m1) |
.6 |
.8 |
.6 |
|
Non-masters (m2) |
.3 |
.6 |
.5 |
Decision rules
The task is to make a best guess as to an examinee’s classification
(master, non-master) based on the data in Table 1 and the examinee’s response
vector. From (2), the probabilities of the vector z= [1,1,0] if the
examinee is a master is .6*.8*.4 = .19, and .09 if he is a non-master. That is,
P(z|m1)=.19 and P(z|m2)=.09. Normalized,
P(z|m1)=.68 and P(z|m2)=.32.
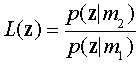
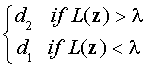
A sufficient statistic for decision making is the likelihood ratio
which for the example is L(z)= .09/.19 = .47. This is a sufficient
statistic because all decision rules can be viewed as a test comparing L(z)
against a criterion value 8.
|
|
(3) |
The value of 8 reflects the selected
approaches and judgements concerning the relative importance of different types
of classification error.
Maximum-likelihood decision criterion
This is the simplest decision approach and is based solely on the conditional
probabilities of the response vectors given each of the mastery states, i.e. P(z|m1)
and P(z|m2). The concept is to select the mastery state that
is the most likely cause of the response vector and can be stated as :
Given a set of item responses z, make decision dk if it
is most likely that mk generated z.
Based on this criterion, one would classify the examinee as a master - the
most likely classification since
P(z|m1)=.68 > P(z|m2)=.32.
This criterion
ignores the prior information about the proportions of masters and non-masters
in the population. Equivalently, it assumes the population priors are equal.
With the example, few examinees are masters, P(mk)=.20. Considering
that the conditional probabilities of the response vectors are fairly close,
this classification rule may not result in a good decision.
Minimum probability of error decision criterion
In the binary decision case, two types of errors are possible - decide d1
when m2 is true or decide d2 when m1 is true.
If one thinks of m1 as the null hypothesis, then in terms of
statistical theory, the probability of deciding a person is a master, d1
when indeed that person is a non-master m2, is the familiar level of
significance, " and P(d2|m2)
is the power of the test, $. When both
types of errors are equally costly, it may be desirous to maximize accuracy or
minimize the total probability of error, Pe. This criterion can be stated
as:
Given a set of item responses z, select the decision regions which
minimize the total probability of error.
This criterion is sometimes referred to as the ideal observer criterion.
In the binary case, Pe = P(d2|m1) + P(d1|m2)
and the likelihood ratio test in (3) is employed with

With the example, 8=.25 and the decision
is d2 - non-master.
Maximum a posteriori (MAP) decision criterion
The maximum likelihood decision criterion made use of just the probabilities
of the response vector. The minimum probability of error criterion also made use
of the prior classification probabilities P(m1) and P(m2).
MAP is another approach that uses the available information:
Given a set of item responses z, decide dk if mk
is the most likely mastery state.
In other words,
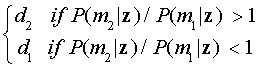
Since from equation (2), P(mk|z)=c P(z|mk)
P(mk), MAP is equivalent to the minimum probability of
error decision criterion.
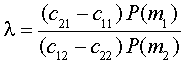
Bayes Risk Criterion
A significant advantage of the decision theory framework is that one can
incorporate decision costs into the analysis. By this criteria, costs are
assigned to each correct and incorrect decision and then minimize the total
average costs. For example, false negatives may be twice as bad as false
positives. If cij is the cost of deciding di when mj
is true, then the expected or average cost B is
B=(c11 P(d1|m1) + c21 P(d2|m1))
P(m1) + (c12 P(d1|m2) + c22
P(d2|m2)) P(m2)
and the criterion can be stated as
Given a set of item responses z and the costs associated with each
decision, select dk to minimize the total expected cost.
For two mastery states, the total expected cost can be minimized using the
likelihood ratio test in (2) with
|
|
(4) |
This is also called the minimum loss criterion and the optimal
decision criterion. If costs c11=c22=0 and c12=c21=1,
then B is identical to Pe and this approach is identical to minimum
probability of error and to MAP. With c11=c22=0
and c21=2, c12=1, and the sample data, 8=.50
and the decision is d2 - non-master.
Adaptive
testing
Rather than make a classification decision for an individual after
administering a fixed number of items, it is possible to sequentially select
items to maximize information, update the estimated mastery state classification
probabilities and then evaluate whether there is enough information to terminate
testing. In measurement this is frequently called adaptive or tailored testing.
In statistics, this is called sequential testing.
At each step, the posterior classification probabilities p(mk|z)
are treated as updated prior probabilities p(mk) and used to help
identify the next item to be administered. To illustrate decision theory
sequential testing, again consider the situation for which there are two
possible mastery states m1 and m2 and use the item
statistics in Table 1. Assume the examinee responded correctly to the first item
and the task is to select which of the two remaining items to administer next.
After responding correctly to the first item, the current updated probability
of being a master is .6*.2/(.6*.2+.3*.8) = .33 and the probability of being a
non-master is .66 from formula (1).
The current probability of responding correctly is
|

|
(5) |
Applying (5), the current probability of correctly responding to item 2 is
P(z2=1)=.8*.33+ .6*.66 = .66 and, for item 3, P(z3=1)=.53.
The following are some approaches to identify which of these two items to
administer next.
Minimum expected cost
This approach defines the optimal item to be administered next as the item
with in the lowest expected cost. Equation (4) provides the decision cost as a
function of the classification probabilities. If c11=c22=0
then
|
B=c21 P(d2|m1) P(m1)
+ c12 P(d1|m2) P(m2) |
(6) |
In the binary decision case, the probability of making a wrong decision is
one minus the probability of making a right decision and the probabilities of
making a right decision is by definition, the posterior probabilities given in
(1). Thus, with c12=c21=1, the current Bayes cost is
B=1*(1-.33)*.33 + 1*(1-.66)*.66 = .44.
Minimum expected cost is often associated with sequential testing and has
been applied to measurement problems by Lewis and Sheehan (1980), Macready and
Dayton (1992), Vos (1997), and others.
The following steps can be used to compute the expected cost for each item.
- Assume for the moment that the examinee will respond correctly.
Compute the posterior probabilities using (1) and then costs using (6).
- Assume the examinee will respond incorrectly. Compute the posterior
probabilities using (1) and then costs using (6).
- Multiply the cost from step 1 by the probability of a correct response
to the item
- Multiply the cost from step 2 by the probability of an in correct
response to the item
- Add the values from steps 3 and 4.
Thus, the expected cost is the sum of the costs of each response weighted by
the probability of that response. If the examinee responds correctly to item 2,
then the posterior probability of being a master will be
(.8*.33)/(.8*.33+.6*.66)=.40 and the associated cost will be
1*(1-.40)*.40+1*(1-.60)*.60 =.48. If the examinee responses incorrectly, then
the posterior probability of being a master will be (.2*.33)/(.2*.33+.4*.66)=.20
and the associated cost will be 1*(1-.20)*.20+1*(1-.80)*.80 =.32. Since the
probability of a correct response from (5) is .66 the expected cost for item 2
is .66*.48+(1-.66)*.32 = .42.
The cost for item 3 is .47 if the response is correct and .41 if incorrect.
Thus, the expected cost for item 3 is .53*.47+(1-.53)*.41 = .44. Since item 2
has the lowest expected cost, it would be administered next.
Information Gain
This entire essay is concerned with the use of prior item and examinee
distribution information in decoding response vectors to make a best guess as to
the mastery states of the examinees. The commonly used measure of information
from information theory (see Cover and Thomas, 1991), Shannon (1948) entropy, is
applicable here:
|

|
(5) |
where pk is the proportion of S belonging to class k. Entropy can
be viewed as a measure of the uniformness of a distribution and has a maximum
value when pk = 1/K for all k. The goal is to have a peaked
distribution of P(mk) and to next select the item that has the
greatest expected reduction in entropy, i.e.
where H(S0) is the current entropy and H(Si) is the
expected entropy after administering item I, i.e. the sum of the weighted
conditional entropies of the classification probabilities that correspond to a
correct and to an incorrect response
|

|
(7) |
This can be computed using the following steps:
1. Compute the normalized posterior classification probabilities that
result from a correct and to an incorrect response to item I using (1).
2. Compute the conditional entropies (conditional on a right response and
conditional on an incorrect response) using (5).
3. Weight the conditional entropies by their probabilities using (7).
Table 2 shows the calculations with the sample data.
|
Table 2: Computation of expected classification entropies for items 2
and 3. |
|
|
Response
(zi) |
Posterior classification probabilities |
Conditional entropy |
P(zi ) |
H(Si ) |
|
Item 2 |
Right |
P(m1 )=.40 |
.97 |
.66 |
.89 |
|
|
|
P(m2)=.60 |
|
|
|
|
|
Wrong |
P(m1)=.20 |
.72 |
.33 |
|
|
|
|
P(m2)=.80 |
|
|
|
|
Item 3 |
Right |
P(m1)=.38 |
.96 |
.53 |
.92 |
|
|
|
P(m2)=.62 |
|
|
|
|
|
Wrong |
P(m1)=.29 |
.87 |
.47 |
|
|
|
|
P(m2)=.71 |
|
|
|
After administering the first item, P(m1)=.33, P(m2)=.66,
and H(S)=.91. Item 2 results in the greatest expected entropy gain and should be
administered next.
A variant of this approach is relative entropy which is also called the
Kullback-Leibler (1951) information measure and information divergence.
Chang and Ying (1996), Eggen (1999), Lin and Spray (2000) have favorably
evaluated K-L information as an adaptive testing strategy.
The reader should note that, the expected entropy after administering item 3
would be greater than H(S) and result in a loss of information. That is, the
classification probabilities are expected to become less peaked should item 3 be
administered. As a result, this item shouldn’t be considered as a candidate
for the next item. One may want to stop administering items when there are no
items left in the pool that are expected to result in information gain.
Sequential Decisions
This article has discussed procedures for making a classification decision and
procedures for selecting the next items to be administered sequentially. This
section presents procedures for deciding when one has enough information to
hazard a classification guess. One could make this determination after each
response.
Perhaps the simplest rule is the Neyman-Pearson decision criteria -
continue testing until the probability of a false negative, P(d2|m1),
is less than a preselected value ".
Suppose "= .05 was selected. After the
first item, the probability of being a non-master is P(m1|z) =
.66. If the examinee is declared a non-master, then the current probability of
this being a false negative is (1-.33). Because this is more than ",
the decision is to continue testing.
A variant of Neyman-Pearson is the fixed error rate criterion -
establish two thresholds, "1
and "2, and continue
testing until P(d2|m1) < "1
and P(d1|m2) < "2.
Another variant is the cost threshold criteria. Under that approach,
costs are assigned to each correct and incorrect decision and to the decision to
take another observation. Testing continues until the cost threshold is reached.
A variant on that approach is to change the cost structure as the number of
administered items increases.
Wald’s (1947) sequential probability ratio test (SPRT, pronounced spurt) is
clearly the most well-known sequential decision rule. SPRT for K multiple
categories can be summarized as
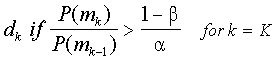
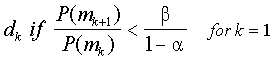
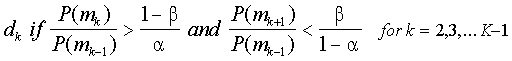
where the P(mj)’s are the normalized posterior probabilities, "
is the acceptable error rate, and $ is the
desired power. If the condition is not meet for any category k, then testing
continues. In the measurement field, there is a sizeable and impressive body of
literature illustrating that SPRT is very effective as a termination rule for
IRT based computer adaptive tests (c.f. Reckase, 1983; Spray and Reckase, 1994,
1996; Lewis and Sheehan, 1990; Sheehan and Lewis, 1992).
Discussion
In their introduction, Cronbach and Gleser (1957) argue that the ultimate
purpose for testing is to arrive at qualitative classification decisions. Today’s
decisions are often binary, e.g. whether to hire someone, whether a person has
mastered a particular set of skills, whether to promote an individual.
Multi-state conditions are common in state assessments, e.g. the percent of
students that perform at the basic, proficient or advanced level. The simple
measurement model presented in this article is applicable to these and other
situations where one is interested in categorical information.
The model has a very simple framework - one starts with the conditional
probabilities of examinees in each mastery state responding correctly to each
item. One can obtain these probabilities from a very small pilot sample. This
research demonstrated that a minimum cell size of one examinee per item is a
reasonable calibration sample size. The accuracies of tests calibrated with such
a small sample size are extremely close to the accuracies of tests calibrated
with hundreds of examinees per cell.
An individual’s response patterns is evaluated against these conditional
probabilities. One computes the probabilities of the response vector given each
mastery level. Using Bayes’ theorem, the conditional probabilities can be
converted to an a posteriori probabilities representing the likelihood of
each mastery state. Alternative decision rules were presented.
This article examined two ways to adaptively, or sequentially, administer
items using the model. The traditional decision theory sequential testing
approach, minimum cost, and a new approach, information gain, which is based on
entropy and comes from information theory.
Research has showed that very few pilot test examinees are needed to
calibrate the system (Rudner, in press). One or two examinees per cell per item
result in a test that is as accurate as one calibrated with hundreds of pilot
test examinees per cell. The results were consistent across item pools and test
lengths. The essential data from the pilot is the proportions of examinees
within each mastery state that respond correctly. One does not truly need a
priori probabilities of a randomly chosen examinee being in each mastery
state. Uniform priors can be expected to increase the number of needed items and
not seriously affect accuracy given properly chosen stopping rules.
This is clearly a simple yet powerful and widely applicable model. The advantages
of this model are many --the model
- yields
accurate mastery state classifications,
- can
incorporate a small item pool,
- is
simple to implement,
- requires
little pre-testing,
- is
applicable to criterion referenced tests,
- can
be used in diagnostic testing,
- can
be adapted to yield classifications on multiple skills,
- can
employ sequential testing and a sequential decision rule, and
- should
be easy to explain to non-statisticians.
It is the author’s hope that this research will capture the imagination of
the research and applied measurement communities. The author can envision wider
use of the model as the routing mechanism for intelligent tutoring systems.
Items could be piloted with a few number of examinees to vastly improve
end-of-unit examinations. Certification examinations could be created for
specialized occupations with a limited number of practitioners available for
item calibration. Short tests could be prepared for teachers to help make
tentative placement and advancement decisions. A small collection of items from
a one test, say state-NAEP, could be embedded in another test, say a state
assessment, to yield meaningful cross-regional information.
The research questions are numerous. How can the model be extended to
multiple rather than dichotomous item response categories? How can bias be
detected? How effective are alternative adaptive testing and sequential decision
rules? Can the model be effectively extended to 30 or more categories and
provide a rank ordering of examinees? How can we make good use of the fact that
the data is ordinal? How can the concept of entropy be employed in the
examination of tests? Are there new item analysis procedures that can improve
measurement decision theory tests? How can the model be best applied to
criterion referenced tests assessing multiple skills, each with a few number of
items? Why are minimum cost and information gain so similar? How can different
cost structures be effectively employed? How can items from one test be used in
another? How does one equate such tests? The author is currently investigating
the applicability of the model to computer scoring of essays. In that research,
essay features from a large pilot are treated as items and holistic scores as
the mastery states.
Note
This tutorial was developed with funds from the National Library of
Education, U.S. Department of Education, award ED99CO0032 and from the National
Institute for Student Achievement, Curriculum and Assessment, U.S. Department of
Education, grant award R305T010130. The views and opinions expressed in this article
are those of the author and do not necessarily reflect those of the funding
agency.
References
Allen, Nancy L., James E. Carlson, and Christine A. Zelenak (2000). The
NAEP 1996 Technical Report. Washington, DC: National Center for
Educational Statistics. Available online: http://nces.ed.gov/nationsreportcard/pubs/main1996/1999452.asp
Baker, F. (2001). The Basics of Item Response Theory. Second
edition. College Park: MD: ERIC Clearinghouse on Assessment and Evaluation.
Birnbaum, A. (1968). Some latent trait models. In F.M. Lord & M.R.
Novick, (Eds.), Statistical theories of mental test scores. Reading,
MA: Addison-Wesley.
Chang, H.-H., and Ying, Z. (1996). A global information approach to
computerized adaptive testing. Applied Psychological Measurement, 20,
213-229.
Colorado State Department of Education (2000). Colorado Student Assessment
Program (CSAP), Technical Report, Grade 5 Mathematics. Available online:
http://www.cde.state.co.us/cdeassess/download/pdf/as_csaptech5math99.pdf
Cover, T.M. and J.A. Thomas, Elements of Information Theory.
New York: Wiley, 1991.
Cronbach, L.J. and Gleser, G.C. (1957). Psychological tests and
personnel decisions.. Urbana: University of Illinois Press
Eggen, T. J. H. M. (1999). Item Selection in Adaptive Testing with the
Sequential Probability Ratio Test. Applied Psychological Measurement,
23(3), 249-61.
Ferguson, R.L. (1969). The development, implementation, and evaluation of a
computer assisted branched test for individually prescribed instruction.
Doctoral dissertation. University of Pittsburgh, Pittsburgh, PA.
Hambleton, R. and Novick, M (1973). Toward an integration of theory and
method for criterion-referenced tests. Journal of Educational Measurement,
10, 159-170.
Huyhn, H. (1976). Statistical considerations for mastery scores. Psychometrika.,
41, 65-79.
Kingsbury, G. G., & Weiss, D. J. (1983). A comparison of IRT-based
adaptive mastery testing and a sequential mastery testing procedure. In D. J.
Weiss (Ed.), New horizons in testing: Latent trait test theory and
computerized adaptive testing (pp. 257-283). New York: Academic Press.
Kullback, S. & Leibler, R.A. (1951). On information and sufficiency. Annals
of Mathematical Statistics, 22, 79-86.
Lewis, C. and Sheehan, K. (1990). Using Bayesian decision
theory to design a computerized mastery test. Applied Psychological
Measurement, 14(2), 367-86.
Lin, Chuan-Ju; Spray, Judith (2000). Effects of
Item-Selection Criteria on Classification Testing with the Sequential
Probability Ratio Test. ACT Research Report Series.
Macready, G. and Dayton C. M. (1977). The use of
probabilitistic models in the assessment of mastery. Journal of Educational
Statistics. 2(2), 99-120.
Macready, G. and Dayton C. M. (1992). The application of
latent class models in adaptive testing. Psychometrika, 57(1), 71-88.
Mislevy, R. J., & Gitomer, D. H. (1996). The role of
probability-based inference in an intelligent tutoring system. User-Mediated
and User-Adapted Interaction, 5, 253-282.
Reckase, M. D. (1983). A procedure for decision making using
tailored testing. In D. J. Weiss (Ed.), New horizons in testing: Latent
trait test theory and computerized adaptive testing (pp. 237-255). New
York: Academic Press.
Shannon, C.E. (1948). A mathematical theory of
communication, Bell System Technical Journal, 27, 379-423 and 623-656,
July and October. Available online: http://cm.bell-labs.com/cm/ms/what/shannonday/paper.html
Sheehan, Kathleen and Lewis, Charles (1992). Computerized
Mastery Testing with Nonequivalent Testlets. Applied Psychological
Measurement, v16 n1 p65-76 Mar 1992
Spray, Judith A. and Reckase, Mark D. (1996). Comparison of
SPRT and Sequential Bayes Procedures for Classifying Examinees into Two
Categories Using a Computerized Test. Journal of Educational and Behavioral
Statistics, 21(4), 405-14.
Spray, Judith A. and Reckase, Mark D. (1994). The Selection
of Test Items for Decision Making with a Computer Adaptive Test. Paper
presented at the Annual Meeting of the National Council on Measurement in
Education (New Orleans, LA, April 5-7, 1994).
van der Linden, W. J. and Mellenbergh, G.J. (1978).
Coefficients for tests from a decision-theoretic point of view. Applied
Psychological Measurement, 2, 119-134.
van der Linden, W. J. and Vos, H. J. (1966) A Compensatory
Approach to Optimal Selection with Mastery Scores. Psychometrika,
61(1), 155-72.
Vos, Hans J. (1999). Applications of Bayesian Decision
Theory to Sequential Mastery Testing. Journal of Educational and Behavioral
Statistics, 24(3), 271-92.
Wald, A. (1947). Sequential analysis. New York:
Wiley.
Welch, R.E. & Frick, T. (1993). Computerized adaptive
testing in instructional settings. Educational Technology Research &
Development, 41(3), 47-62.
Wood, R. (1976). Adaptive Testing: A Bayesian Procedure for
the Efficient Measurement of Ability. Programmed Learning and Educational
Technology, 13, 2, 36-48.
|